Elegant and Wrong
Before a company can go public, it files an S-1. SpaceX’s ran more than 350 pages, and the data underneath was denser still: eleven megabytes of HTML, 160 tables, more than twelve thousand cells. The form is heavily regulated, down to how the financial statements are presented and audited. If rules alone could make data clean, an S-1 is where it would show.
They can’t. Open the HTML and 49.8% of those cells are empty: blank spacer cells that align dollar signs and digits. Row labels trail off in runs of dots, Revenue… That much you can strip and forget. The table is still a picture of data, not data, and the picture is where the trouble starts.
This is the lesson real data keeps teaching, and the one that shaped how we built citations. The clean, generic data model you reach for first is a hypothesis, not a fact, and the data is free to reject it.
You can’t trust the table
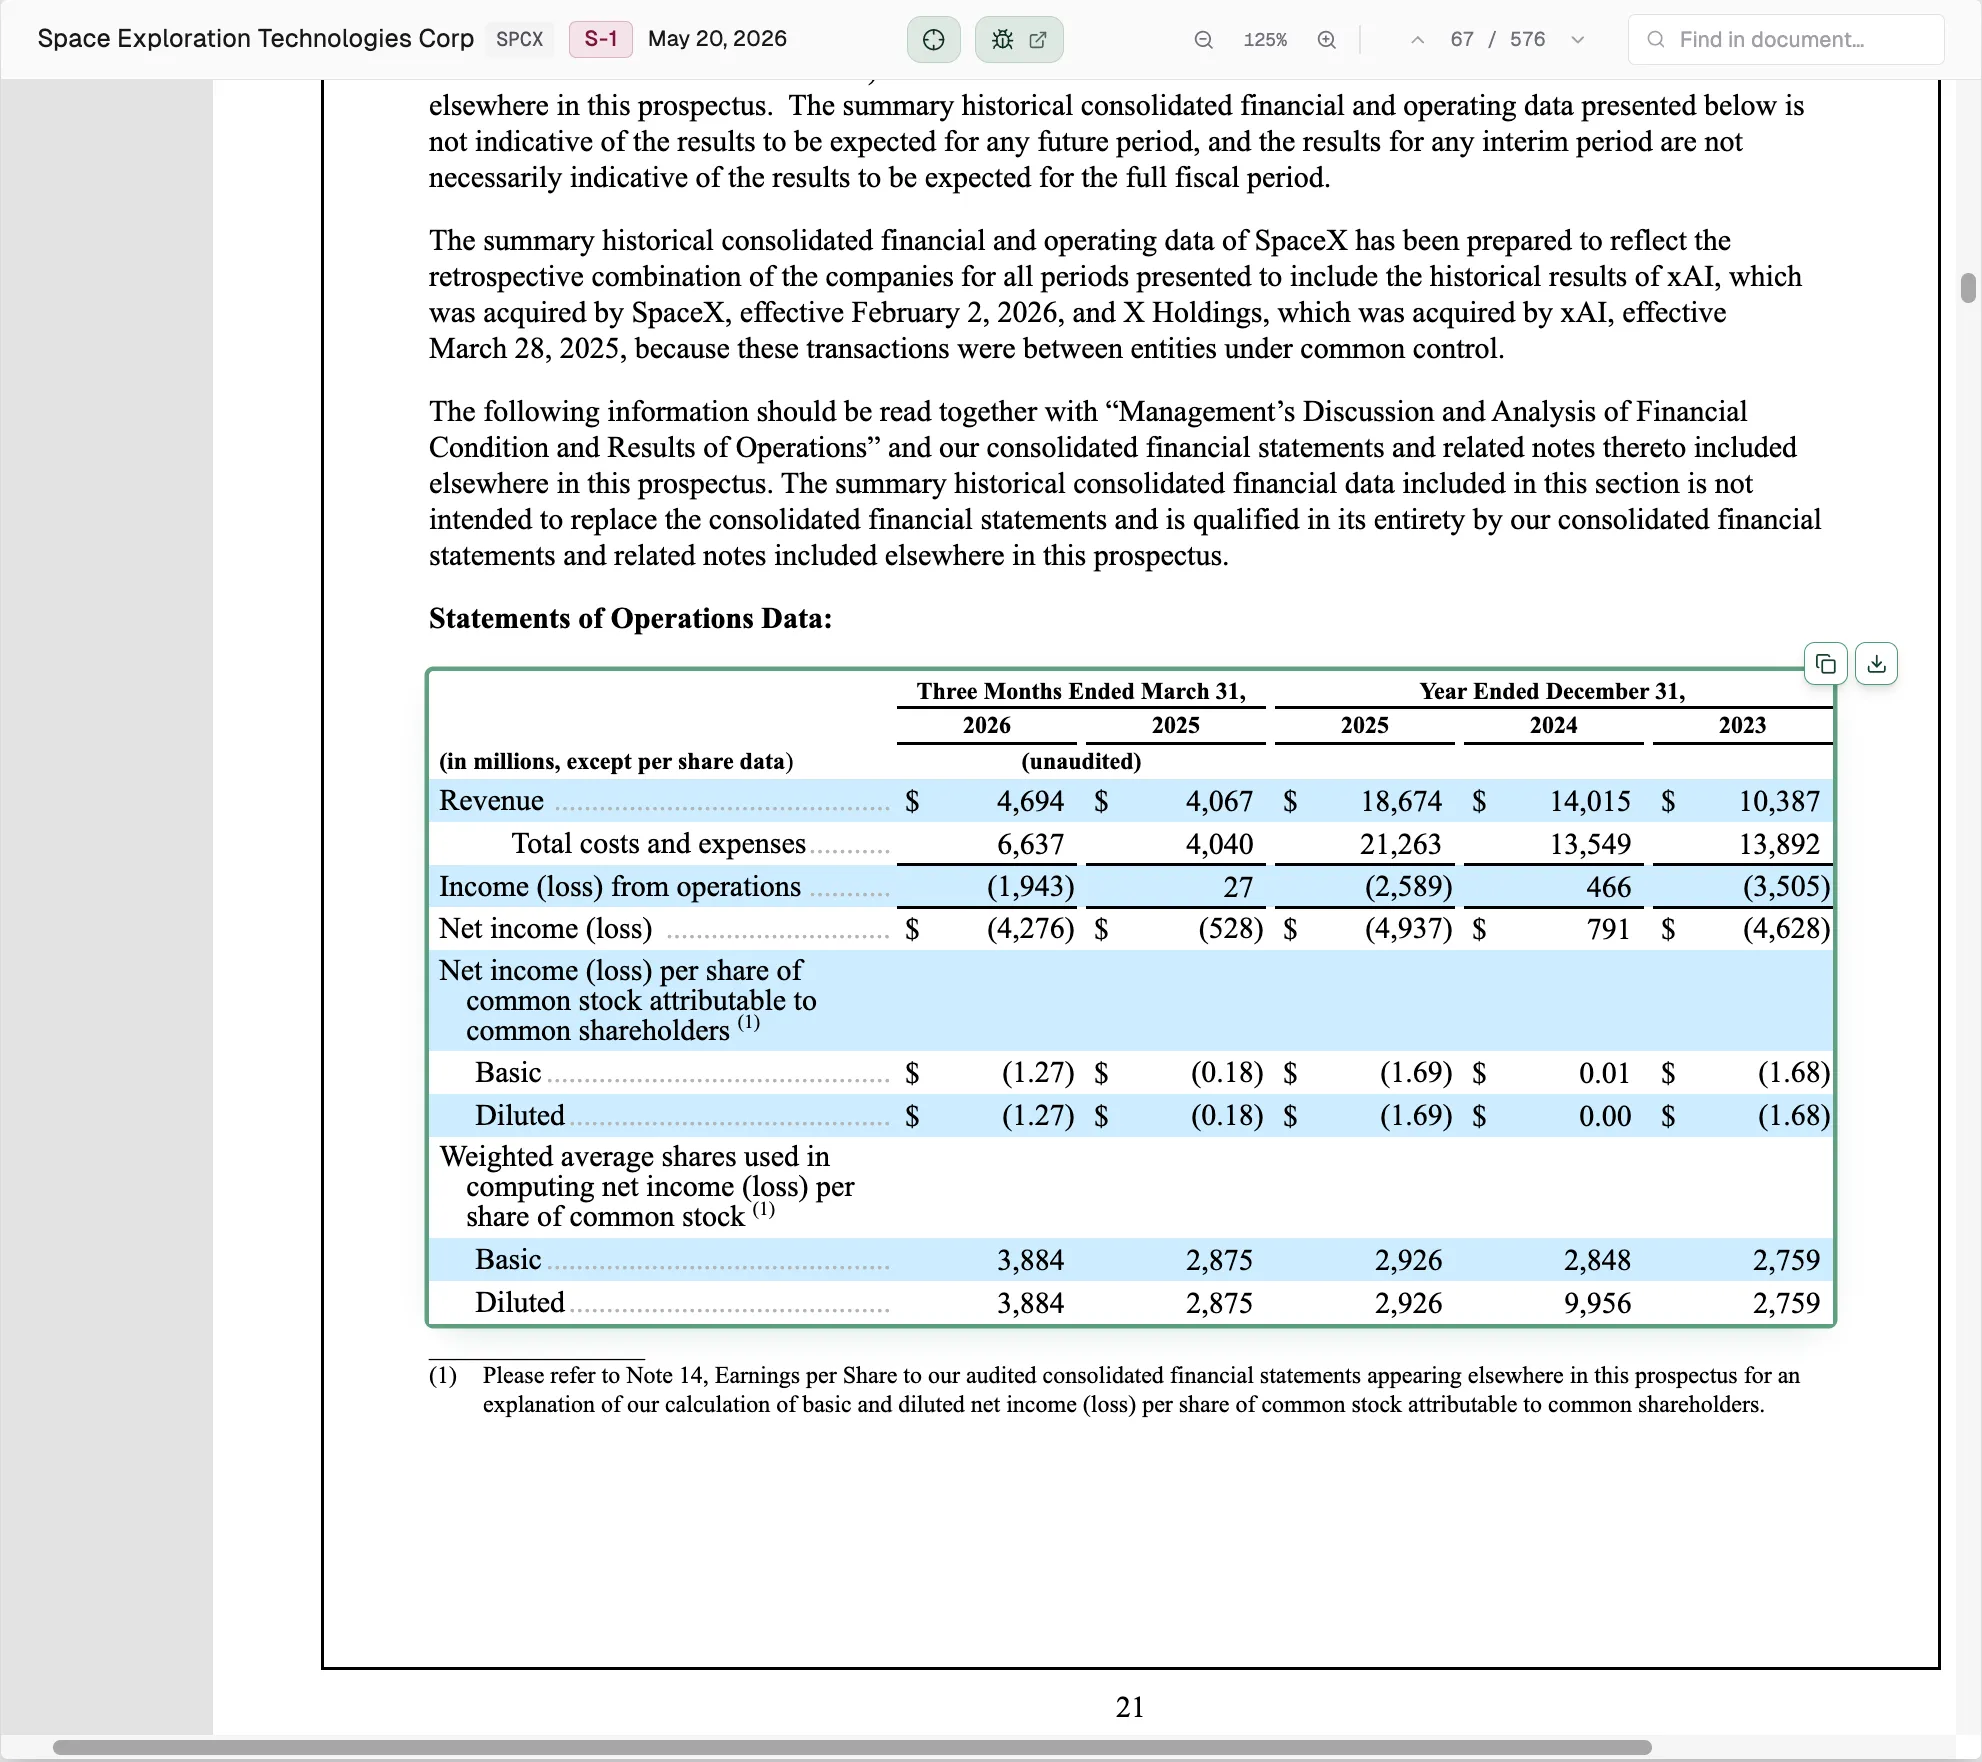
Take SpaceX’s income statement. It’s really two tables sharing one column of labels. As the HTML carries it, the header is two stacked rows:
| Three Months Ended March 31 | Year Ended December 31 | ||||
|---|---|---|---|---|---|
| 2026 | 2025 | 2025 | 2024 | 2023 | |
| Revenue | $4,694 | $4,067 | $18,674 | $14,015 | $10,387 |
An income statement reports a company’s revenue and costs over a period, and filings show several periods at once: the most recent quarter beside the last few full years. The header is the only thing telling those columns apart, and it stamps “2025” on two of them, the three months ending March 31 and the full year ending December 31. So the filing carries two different 2025 revenues: $4,067 million for the quarter and $18,674 million for the year. Ask for “2025 revenue” and one answer is more than four times the other, with nothing in the cell to say which you got.
Reading down a single column is no safer. One parenthetical, “(in millions, except per share data),” sets the scale, and the scale changes line to line:
| In the full-year column | The cell says | It means |
|---|---|---|
| Revenue | 18,674 | $18.674 billion |
| Basic | (1.69) | −$1.69 per share |
| Basic | 2,926 | 2.926 billion shares |
One column, three units, and “Basic” labeling two unrelated rows, earnings per share and the share count used to compute earnings per share, told apart only by the section heading above each. The difficulty was never the dots or the blank cells. It is that the table encodes a schema it never states, and the display is the only copy you get.
The document also doesn’t sit still. SpaceX filed this S-1 on May 20 and amended it twelve days later. In those twelve days, completed Starship flight tests went from 11 to 12, and the operating metrics gained a new value. Once SpaceX is public, these same numbers will reappear every year in a 10-K, its annual report, this time carrying clean XBRL tags, the machine-readable layer the SEC requires on those reports. Every version is a real source someone might cite, and they don’t always agree. Clean is not a finish line. It is one more version of the fact to reconcile with the rest.
Every source is a picture of data
This messiness isn’t unique: it’s characteristic. Every income statement does some version of it, which is the point. We stopped calling these edge cases, because when the edges are most of what you meet, they are not edges. They are the distribution, and you build for the distribution you have.
And all of it is one kind of problem, in one table, in one form, of one source. SEC filings are the most structured input we get, and that is what they look like underneath. Every other source has to be just as citeable, down to the single number, and none of them are cleaner. An earnings-call transcript is speech: someone says “five billion,” and you recover five billion of what, in which currency, for which segment. An investor deck buries the figure in a chart, as pixels. News rounds it and rounds it again. Market data looks clean until a split or a dividend adjustment means the price on the screen is not the price you need.
A single abstraction over all of that would have shattered on the second source, so we never built one. Instead of unifying the sources, we unified one level up. Each source decides, on its own terms, what makes one of its facts addressable: a cell in a table, a moment in a transcript, a mark on a chart. Sources stay messy. Citations stay uniform. A new source only has to solve its own fact location and schema.
A citation is a place
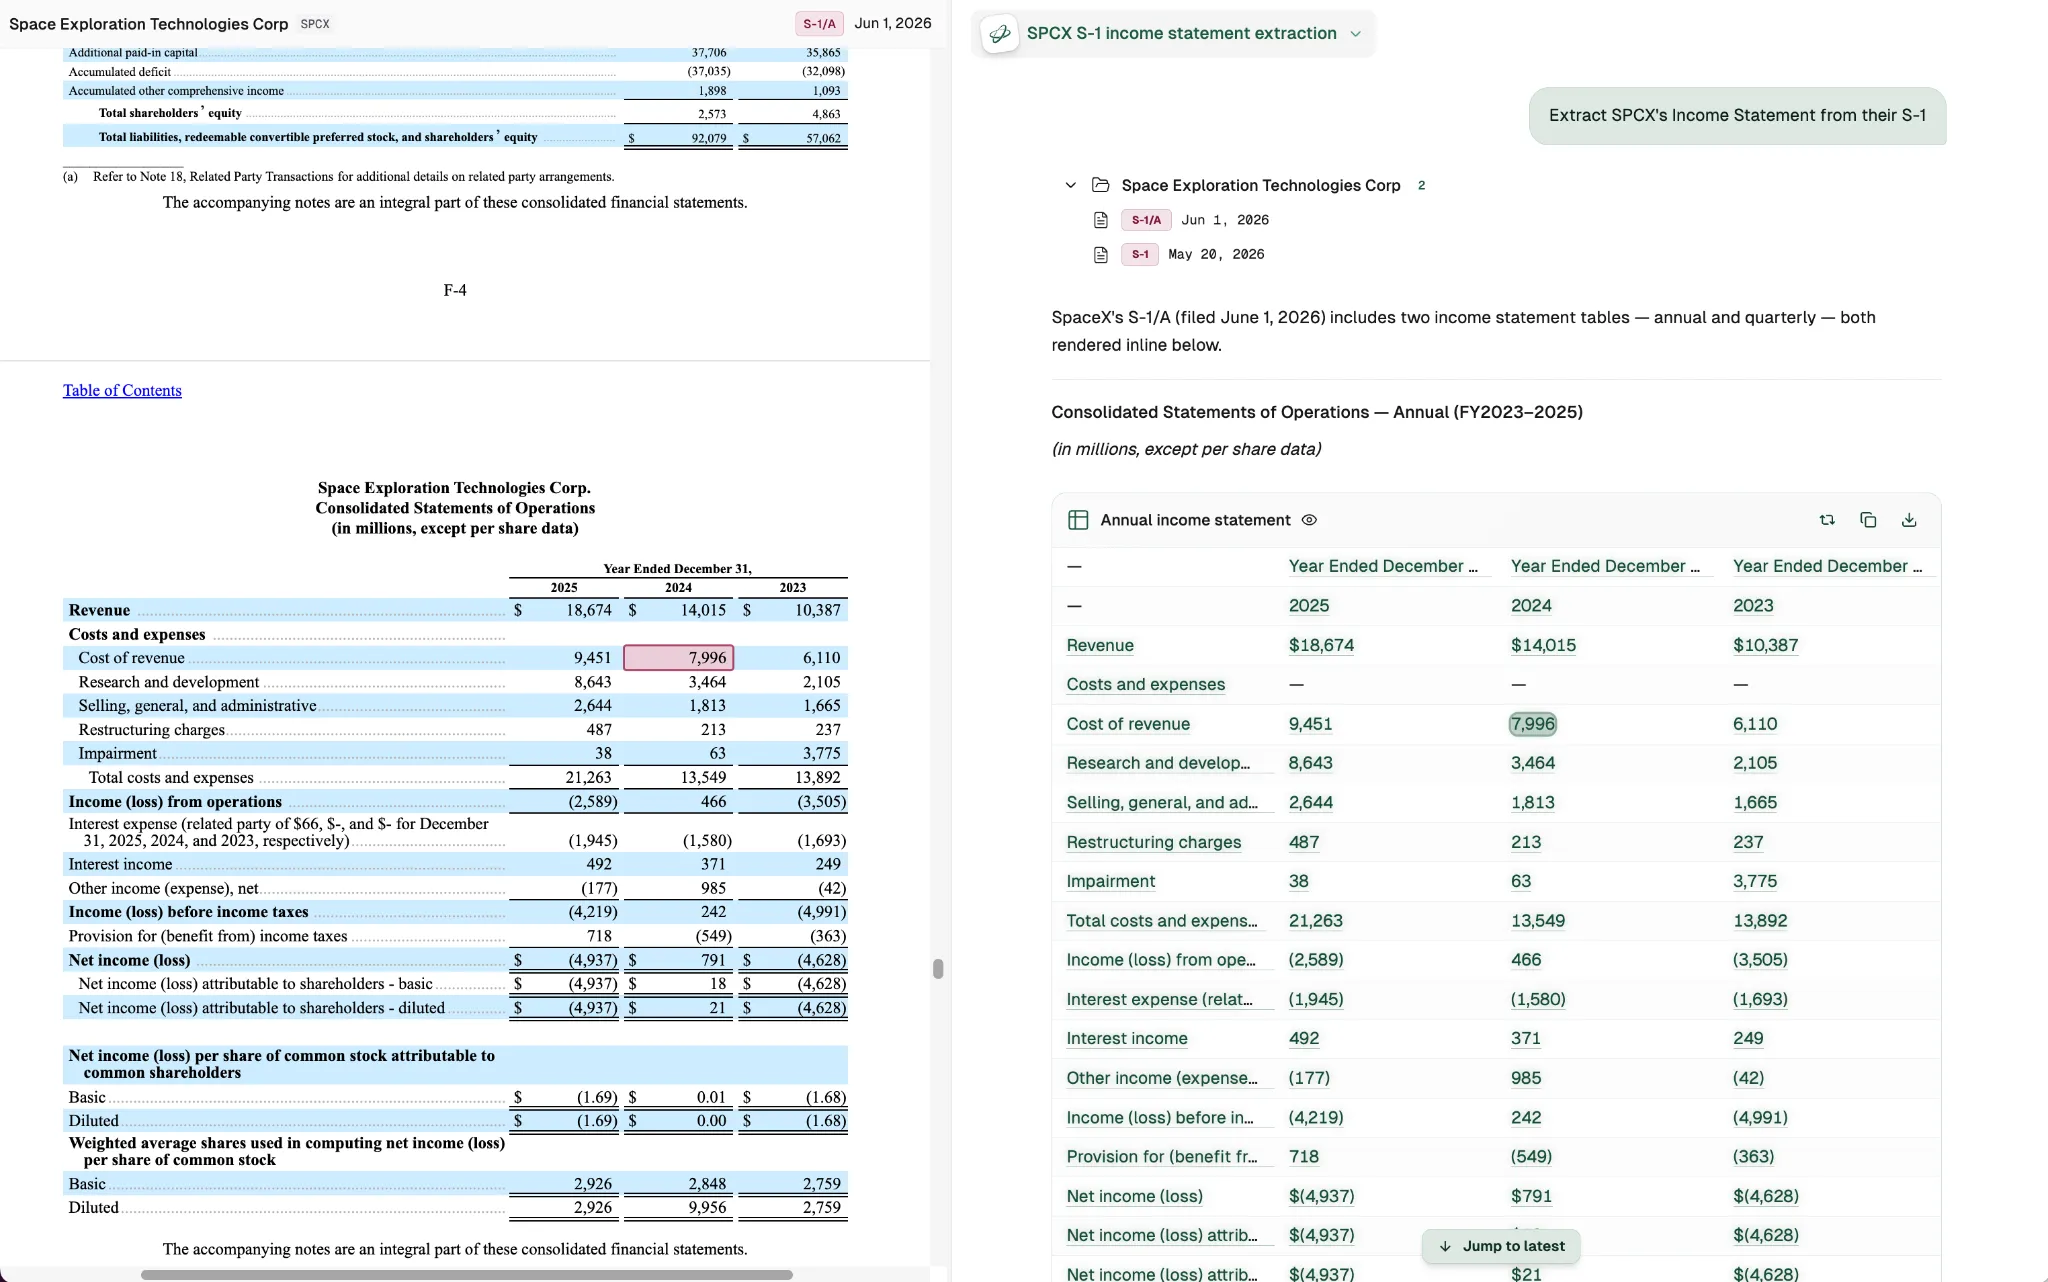
Inside one filing the problem inverts: not too many kinds of a fact, but too many copies of it. SpaceX’s $18,674 million of 2025 revenue appears ten times across the S-1, in the statements, the selected-financials table, the management discussion (MD&A), a line of prose. Sometimes it is the first column, sometimes the third. Search for the value and you find all ten, with no way to know which one the model meant, because nothing in the text marks one as right. Patch that with heuristics and looser matching and the fallback path soon grows faster than the happy path. That is the tell that you’re solving the wrong problem.
So a citation stopped being a value and became a place: a specific cell, in a specific table, in a specific section with meaning. The model emits an address or table reference along with the number, and a check confirms the cell at that address holds what the model claimed. The citation is verifiable, not just plausible. Because the address can be recomputed, the system can always verify a citation still points where it should, so the data changing underneath gets caught instead of quietly going wrong.
The addresses were there the whole time, in the structure that first looked like noise.
Markdown is what engineers want to standardize on: clean and readable. HTML is what actually preserves a filing’s meaning, the merged headers and column spans that pin each number to a period and a scale.
It is old and ugly, and it keeps the guarantees the prettier format throws away. The work was to stop flattening that structure into something readable and wrong, and to trust the addresses already in it. The fuzzy-matching fallbacks we had piled up stopped mattering, and we deleted them.
Following the data
Our namesake, Johannes Kepler, spent years on a problem like this. He inherited Tycho Brahe’s observations, the most precise measurements of the sky anyone had yet made, and tried to fit the orbit of Mars to a circle, because for two thousand years everyone knew the heavens moved in circles. His best circle missed Brahe’s data by eight arcminutes, a gap most would have written off as error. He refused to. The circles never fit; the ellipse did.
That is the whole job, four hundred years apart. The elegant model is the circle; the data is the ellipse. We keep the ellipse because the goal underneath all of this comes down to one sentence: every number Kepler shows can be traced to where it came from, whether that is a cell in a filing or the calculation that produced it. That is what verifiable AI requires, and no model is clever enough to skip it.
You earn it by handling the data the world actually files. Kepler runs at decision points and in work that goes in front of clients and regulators, where a confident wrong number costs far more than an honest “not yet.”
Sara recently wrote about what happens after an answer exists: how do you grade it? This is about what has to be true first. You can’t grade, or trust, a number you can’t trace to where it came from.
If this is the kind of problem you want to work on, we’re hiring.